The dashboard at FigsFlow, which gives you a holistic view of business performance, and helps to streamline your strategy based on the insights.
Watch Video Guide #
The Core Insights to Look At #
With FigsFlow, you can have a clear picture of your turnover for a given month, quarter of a year. The core insights include the following:
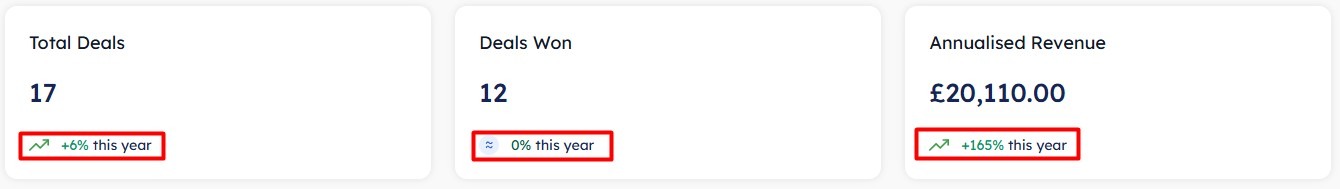
- Total Deals
- Deals Won
- Annual Revenue
- Revenue based on product lines
- Conversion rate
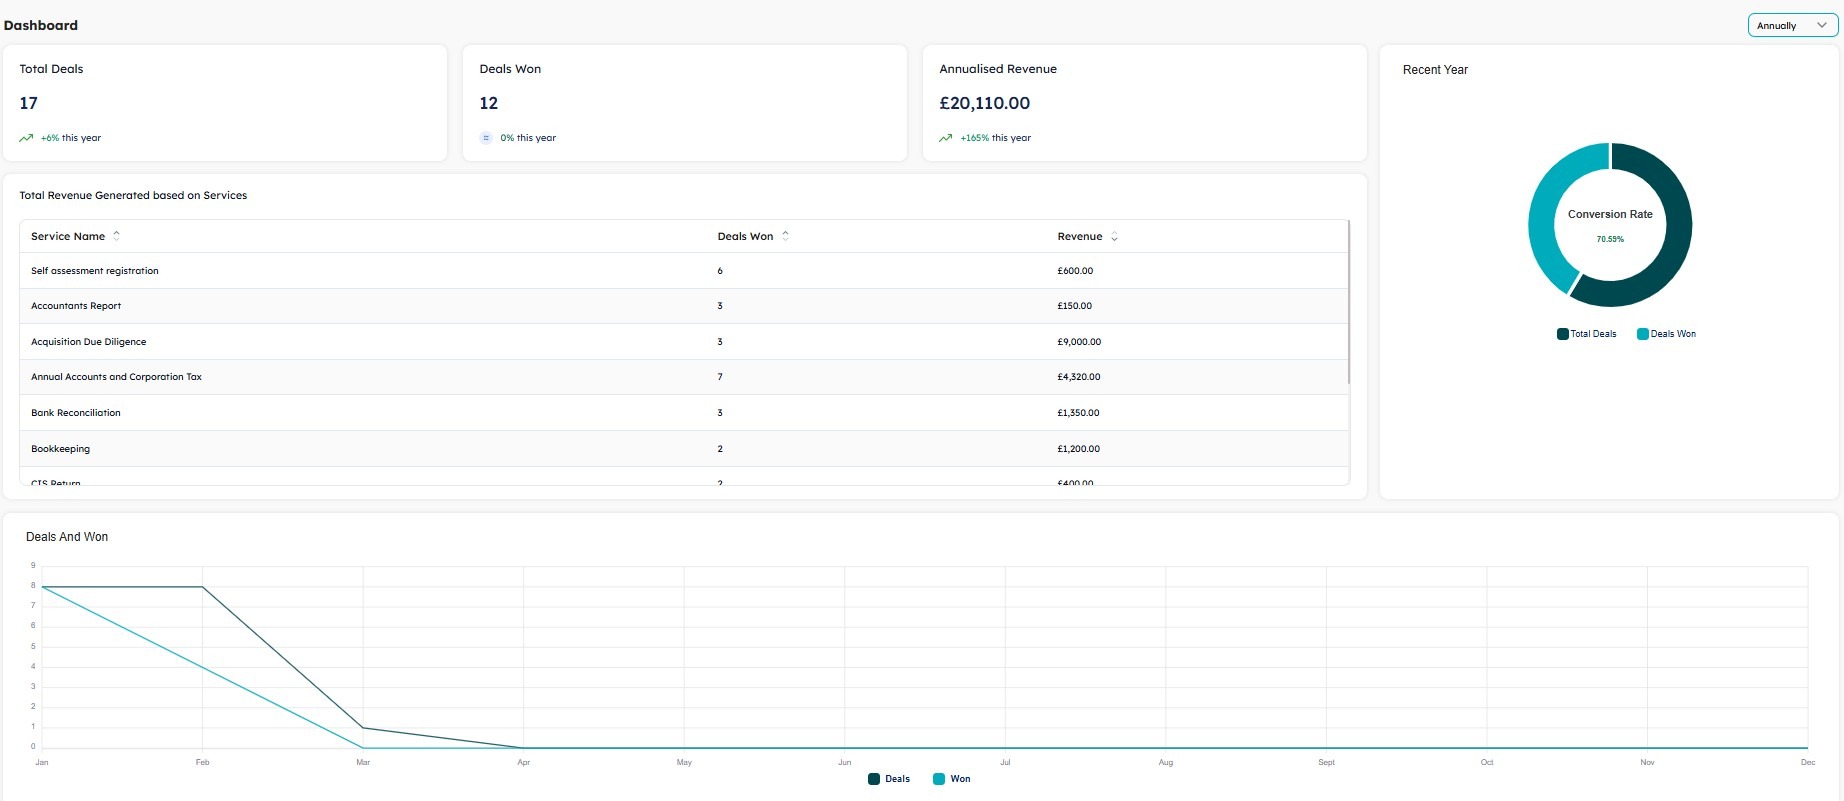
On the top-right side of the dashboard use the filter to get the monthly, quarterly, and yearly overview of the revenue generated.
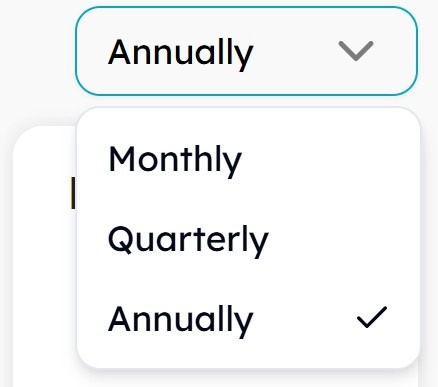
On applying the Monthly, Quarterly and Annually filter, you will have the comparison report with the previous timeline. Click on the numbers to get insights into the individual deal record contributing to your revenue.
Get an overview of how an individual service is performing with ‘Total Revenue Generated based on Services’ report
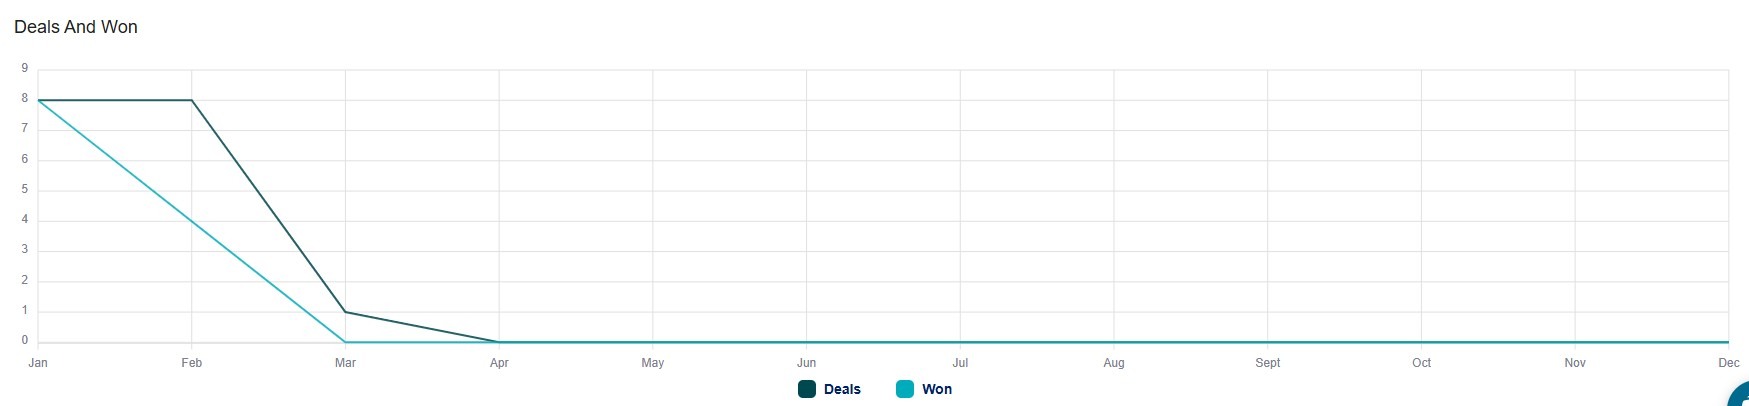
Lastly, get a parallel view of the closed deal against the total deals on your dashboard to analyse and map the trends within a given timeline.